Extreme weather · 9:16 video with real data

The official alert becomes a video that holds attention

NASA satellite imagery, INMET alerts by municipality and gridded forecasts, animated on a 3D map, with each number appearing the moment it is spoken.
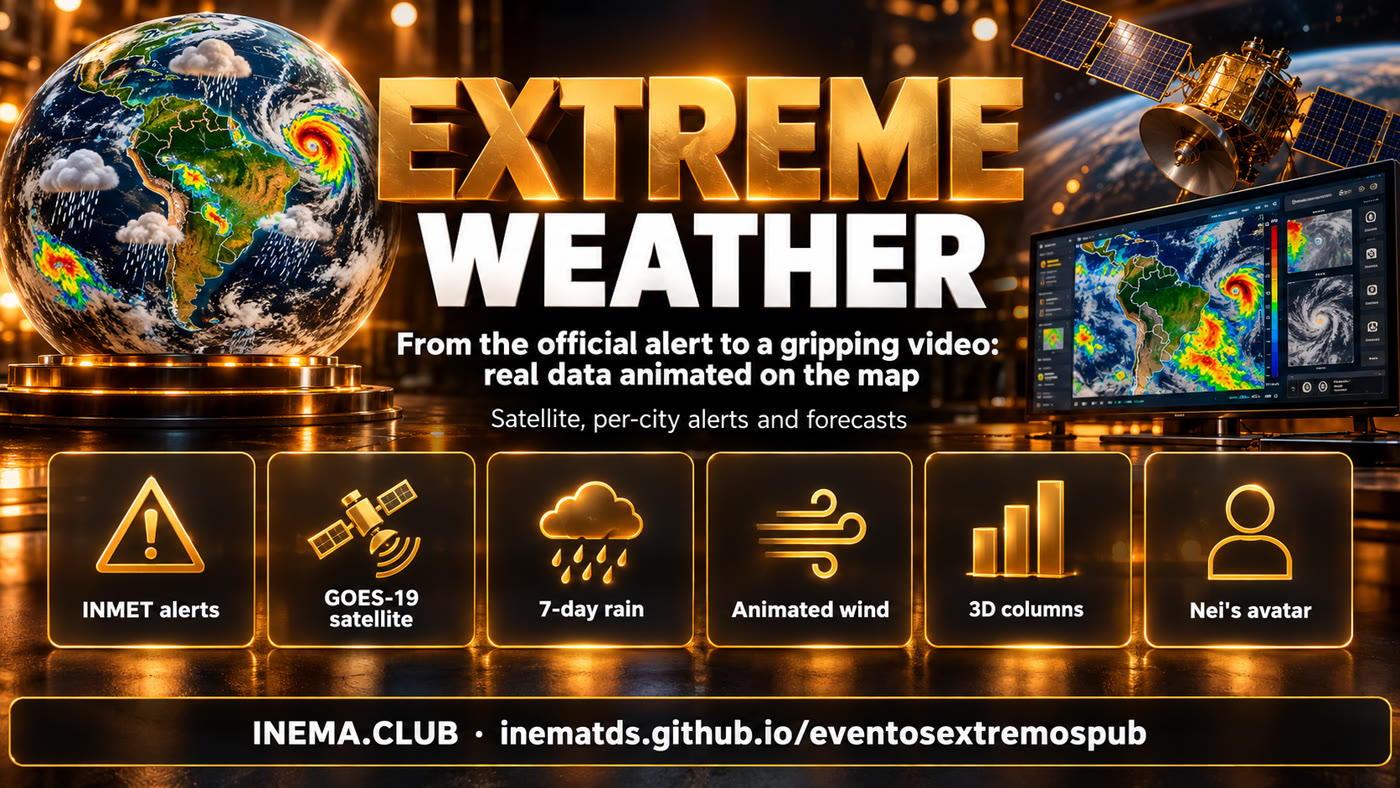
eventosextremospub banner: weather alerts as video with real data
In short

eventosextremospub is a set of scripts that turns a severe-weather alert into a short vertical video (Reels, Shorts, TikTok). It downloads data from public sources: INMET alerts with the list of municipalities, GOES-19 satellite imagery via NASA, and rain and wind forecasts from Open-Meteo. Then it animates everything on a 3D map of Southern Brazil, with narration and word-by-word captions. It is for people who make weather content and want checked numbers, with the source on screen, instead of reposting a website screenshot. It needs a computer with a graphics card, Node with Playwright, Python, ffmpeg and, for the voice, the cardshorts project.

What it is

Three parts: news, animation and avatar

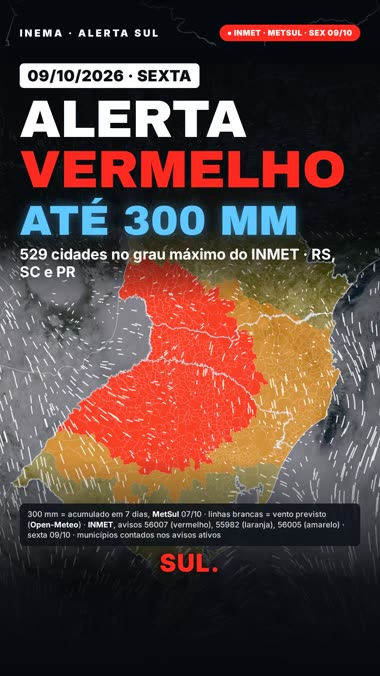
It started from a red-alert video about Southern Brazil (Oct 9, 2026). The research, the map engine and the assembly became scripts you can repeat for any event.

Parts of eventosextremospub: INMET alerts, satellite, 7-day rain, wind, 3D columns and avatar

📡 News with sources

Automatic collection from INMET, NASA and Open-Meteo, plus a list of checked sources. What already happened is kept apart from what is forecast.

🗺️ Animation that holds attention

Municipalities colored by alert level, an infrared timelapse of the storm, flowing wind, 3D columns of rain and gusts, counters.

🧑‍💼 Avatar

The presenter comes in through the HeyGen studio, in the same 9:16 format as explicavideos, and the map follows his speech.

How it works

From alert to MP4

The map is an HTML page with deck.gl. Headless Chrome captures one frame at a time on the GPU (about 0.1 s per frame), and ffmpeg joins it with the voice and the soundtrack.

INMET · NASA · Open-Meteo→ base.md (research)→ falas.json→ Checked voice→ cena.js (timeline)→ 3D map frame by frame→ 9:16 MP4

Alerts

Each municipality colored by its INMET warning (yellow, orange, red), day by day.

Satellite

GOES-19 true color as the background and the cloud-top infrared as a timelapse, with a clock.

Forecast

7-day accumulated rain as columns and forecast wind as animated particles.

Text

Opening with the date and the strongest number, a panel with a counter, the source on screen and colored captions.

Prerequisites

What needs to be installed

The data sources are free and need no key. The free Open-Meteo tier limits calls per minute, and the script already waits when that happens.

Map and render

Node with Playwright, Chrome with Vulkan (graphics card) and ffmpeg.

npm i -g playwright
npx playwright install chromium

Geographic base

IBGE municipalities, states, countries and rivers (Natural Earth), downloaded once.

geo/baixar.sh
python3 motor/prep_geo.py

Voice

Narration with a cloned voice through cardshorts (local Chatterbox and Whisper) or the HeyGen avatar.

git clone https://github.com/inematds/cardshorts
User guide · step by step

One edition, from data to video

Each video is a folder in edicoes/, with that day's research, lines and data.

1

Create the edition and download the alerts

Lists each active INMET warning with how many municipalities it covers in each state.

git clone https://github.com/inematds/eventosextremospub && cd eventosextremospub
E=edicoes/2026-10-09-alerta-sul
python3 coleta/inmet_avisos.py $E
# 56007 Storm (Great Danger) 2026-10-09 00:01 → 23:59  529 municipalities
2

Download the satellite imagery

The true-color base and the infrared sequence for the timelapse. Times in UTC.

python3 coleta/satelite_gibs.py $E --base 2026-10-08T18:00 \
  --de 2026-10-08T12:00 --ate 2026-10-09T05:00 --passo 20
3

Download the forecast

7-day rain on a 0.5° grid and hourly wind for the chosen day.

python3 coleta/openmeteo.py $E --dia 2026-10-09
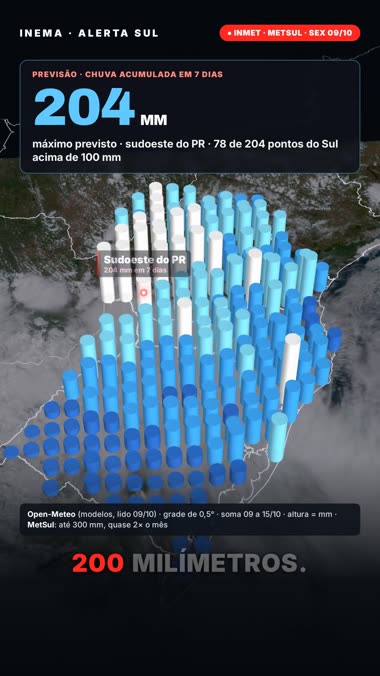
# prev7: 204 points · max (204, [-53.5, -25.5]) · >100 mm in 78
4

Write the research and the lines

In base.md, every number with its source and time, separating what happened from what is forecast. In falas.json, the spoken text, short and direct. The opening carries the date and the strongest number that has a source.

[{"id": "f1", "fala": "Red alert in the South. Today, Friday, five hundred and twenty-nine cities..."},
 {"id": "f2", "fala": "Rio Grande do Sul, three hundred and fifteen..."}]
5

Record the voice and build the timeline

The narration is checked by transcription. gerar_cena.py ties each animation to the spoken word (the counter goes up when the number is said).

python3 $E/narrar.py        # → narracao.wav + tempos.json
python3 $E/gerar_cena.py    # → cena.js
6

Check frames and assemble

Look at a few frames before the full render. Frame 0 has to open full.

node motor/render.mjs $E --quadros 0,18,30,47
motor/montar.sh $E $E/video.mp4
Example

Southern Alert · Oct 9, 2026

First edition: 529 cities under red alert in RS, SC and PR, without the avatar. The first 32 seconds:

On screenSource
529 cities in red (RS 315, SC 128, PR 86)INMET, warning 56007
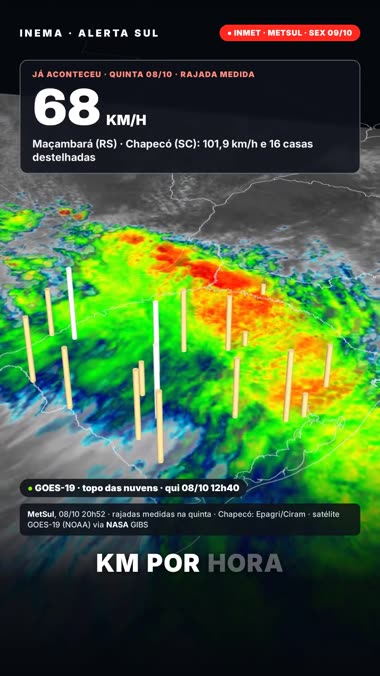
109 km/h gust in Maçambará, 16 houses lost their roofs in ChapecóMetSul, Epagri/Ciram, Oct 8
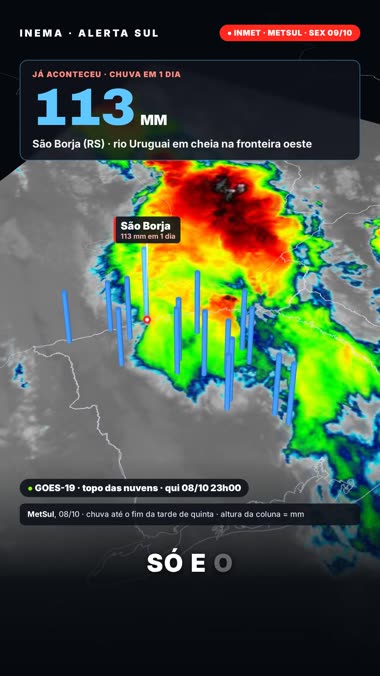
113 mm in São Borja in one dayMetSul, Oct 8
Storm moving from Thursday 9 a.m. to Friday 1:40 a.m.GOES-19 (NOAA) via NASA GIBS
Map from Friday to MondayINMET, warnings 56004, 55993, 55997
Up to 204 mm in 7 days in southwestern PROpen-Meteo
Opening with date and headline Gusts over the infrared Rain in São Borja Forecast rain over 7 days
Roadmap

What comes next

The first edition validated the engine and the data collection. Next steps:

Now
Data collection, map engine and first editionAlerts by municipality, satellite, timelapse, wind, 7-day rain, checked voice.
Next
Avatar in the explicavideos formatPresenter through the HeyGen studio in a strip below the map, with the map synced to his speech.
Later
More events and more regionsCyclones, heat and cold waves, lightning and river levels (CEMADEN, SGB), plus other states.