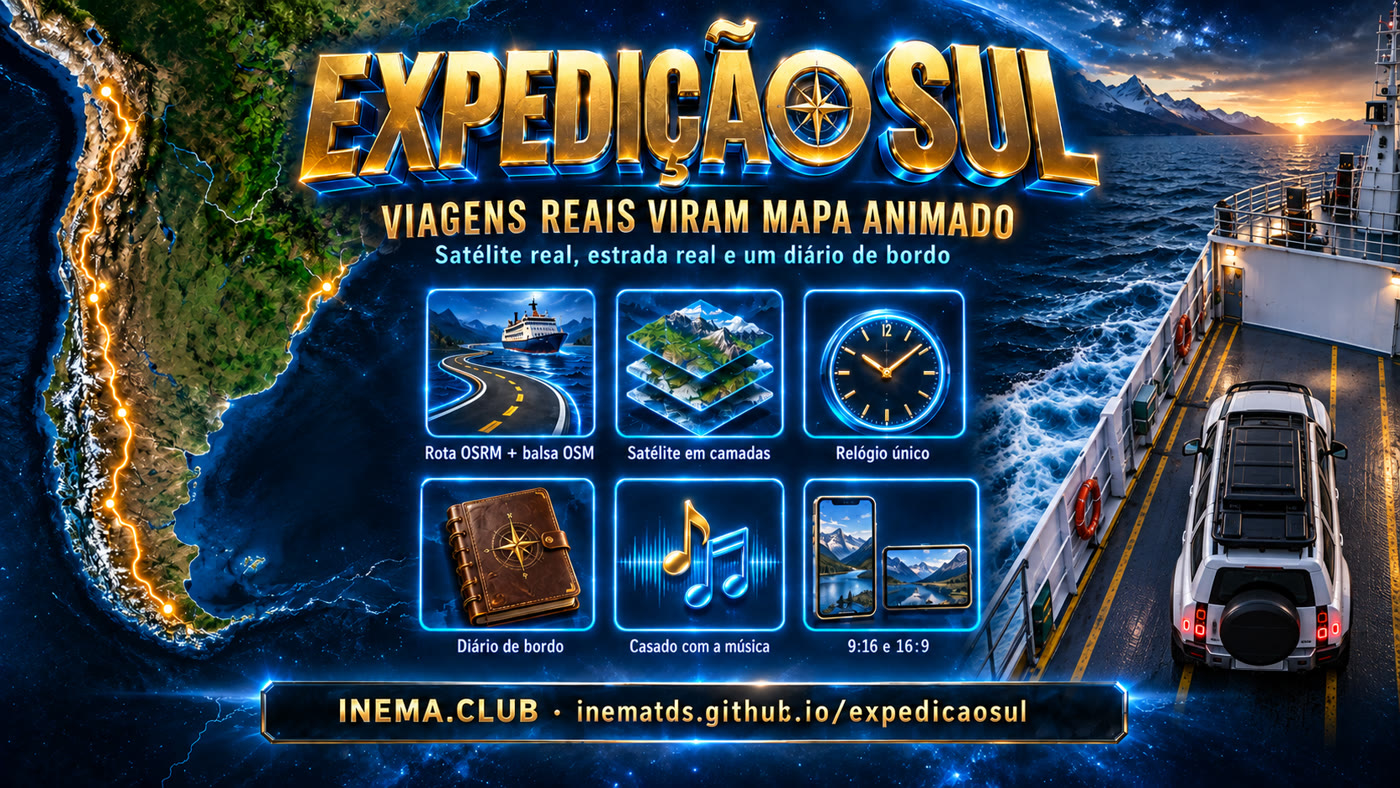
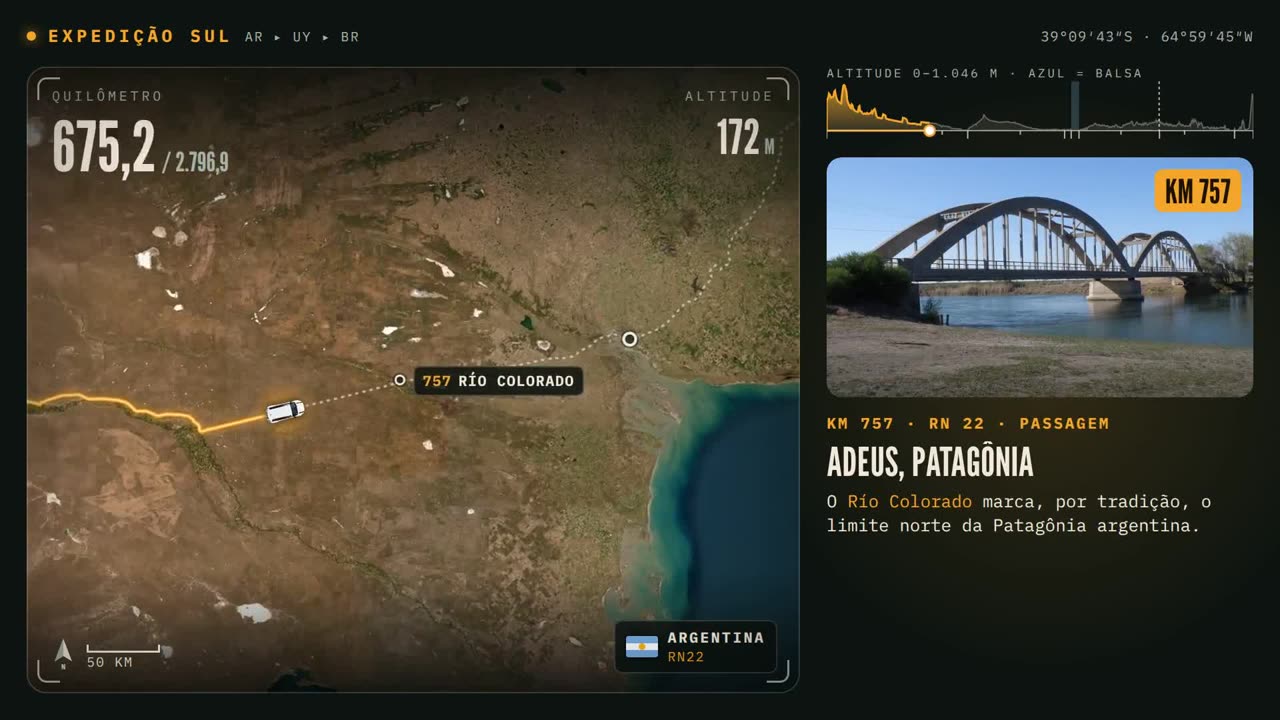
Three car trips through the Andes, the pampas, and Uruguay’s coastline: real satellite, the car on the real road, HUD with km, altitude, and country, plus a logbook with a photo and a verified fact about each place.
Each trip comes out in 9:16 (Reels/Shorts/WhatsApp) and 16:9 (YouTube/TV). The files here are the web version (30 fps); the 60 fps masters are outside git.
Hua Hum: our plan and our adventure
The plan (SMA ▸ Pirihueico) and what happened: road cut off at km 32, Taos, the Defender 110 reaches the Río Hua Hum bridge, and the border is closed due to landslides. Overview map + detailed map + 43 trip photos · 2 min 54 s.
Nothing here is assembled by hand in a timeline. One HTML page reads the trip data and draws each frame; HyperFrames records that page as a video.
🛰️ Everything is real data
OSRM road segments, ferry and OpenStreetMap borders, Esri satellite, SRTM altitude, facts from Wikipedia, and photos from Wikimedia Commons with author and license.
⏱️ A single clock
Car, camera, traveled line, pins, HUD, altitude track, and cards all come from the same time function. That’s why nothing comes out of sync.
🎵 Synced to the music
The soundtrack is analyzed (BPM and phase): the car sets off when the beat comes in, the ferry crosses during the calm segment, and the border stamp drops on the return.
How the engine works
From the Google Maps link to MP4
There are two halves: Python scripts that prepare the data (run once per trip) and an index.html that draws the frame from that data, for any instant t.
Stops from the link→OSRM route + OSM ferry→route.js (single km)→Layered satellite→Photos + facts→trip.js (schedule)→index.html renders t→HyperFrames → MP4
1 · Anatomy of a frame
Map: satellite mosaic; the camera follows the car and changes zoom by itself.
Vehicle: top-down sprite (generated in flux2-klein), rotated by the road direction.
HUD: current / total kilometer, altitude (SRTM), country flag, and road name (RN22, BR-290…).
Altitude track: the profile of the entire trip, with a cursor walking along with it.
Logbook: card with a photo, a kilometer, and a verified fact; some are data cards (altitude chart, counters).
2 · Prepare the data (data/, Python)
Each trip has its own folder data/ with the scripts and the output. The scripts talk directly to open APIs and store a local cache.
Script
What it does
It outputs
build_route2.py trip.json
It joins the OSRM legs and the ferry line (OSM) into a single route, with a single cumulative kilometer. It marks where the ferry starts/ends and where the border is (OSM polygon admin_level=2), fits each stop at the right kilometer, and looks up altitude every 5 km from OpenTopoData (SRTM 30 m). It resamples the route every 0.15 km in Web Mercator coordinates z14.
route_full.json → assets/route.js
build_tiles.py
It downloads the Esri satellite in four levels: ov z7 (overview), cor z8 (route corridor), and for each stop p10 z10 (±1.2°) and p12 z12 (±0.3°). Each level turns into a graded JPG with its position in the world.
assets/map/*.jpg + assets/layers.js
photos_search.py q.json dir
Looks for candidates in Wikimedia Commons (JPEG, landscape, ≥ 1400 px) and assembles contact sheets to choose.
contact sheets → picks.json
photos_get.py picks.json
Downloads the selected ones at 1600 px and saves the author, license, and page for each one.
assets/photos/ + photo_credits.json
fetch_facts.py pages.json
Downloads the text of the Wikipedia entries (ES/PT/EN). Each sentence of the cards comes from there, with the source saved.
data/facts/*.json
beat.py música.mp3
Measures BPM and phase of the beat and the bar (spectral flow + autocorrelation). This tells you what second the car sets off and when the border stamp drops.
numbers for the trip.js
3 · Describe the trip (assets/trip.js)
This is the video script, written by hand. It says when the car is at each stop; the engine calculates everything else.
// trecho real de volta-defender/assets/trip.js
schedule: [
  { id: "sma",       dep: 9.4,             dwellKm: 42 },  // larga quando o groove entra (9,4 s)
  { id: "bb",        arr: 27.0, dep: 28.2, dwellKm: 42 },  // Bahía Blanca
  { id: "ferry_ba",  arr: 50.6, dep: 56.2, dwellKm: 80 },  // embarca em Buenos Aires
  { id: "ferry_col", arr: 64.8, dep: 66.4, dwellKm: 50 },  // desembarca em Colonia
  ...
],
ferry:  { dep: 56.2, arr: 64.8 },                         // travessia no trecho calmo da trilha
stamps: [{ t: 64.8, s1: "ARGENTINA ▸ URUGUAI", s2: "COLONIA" }, ...],
cards:  [{ id: "sma", s: 7.2, e: 13.2, img: "sma", km: "0", ttl: "San Martín de los Andes", body: "..." }, ...]
arr/dep = second it arrives and leaves; dwellKm = how many km fit in the width of the frame while it’s stopped there (the stop zoom). cards have start and end (s/e) in seconds; stamps are the border stamps.
4 · Draw the frame (index.html, JS + GSAP)
One GSAP timeline animates a number, t, from 0 to the duration. On each change it calls render(), which recalculates everything from scratch for that t. HyperFrames advances time frame by frame and records.
tl.to(st, { t: T.dur, duration: T.dur, ease: "none", onUpdate: render }, 0);
// render(): para o instante t
km = progress(t) // onde o carro está (em km)
[x, y] = posAt(km) // ponto da estrada nesse km
cam = camera(t) // centro + escala do mapa// → posiciona camadas de satélite, linha, pinos, rótulos, carro, HUD, trilho
t→km
Time becomes kilometers
Between the departure of one stop and arrival at the next, progress(t) uses a trapezoidal speed profile: accelerates, drives at a constant speed, brakes. While stopped, the kilometer doesn’t change. Since the kilometer is unique for the whole trip, ferry and road share the same axis.
cam
The camera directs itself
At the stop, the zoom shows dwellKm of width. In the middle of the segment, it zooms out to see ~85% (sine curve) and looks 20% ahead of the car; it doesn’t zoom out on the ferry. The video starts in overview, dips down to the departure, and in the end comes back to the whole route. Zoom is interpolated on a logarithmic scale, so it’s smooth.
z7–12
A satellite that only appears fully intact
The z7 → z8 → z10 → z12 layers are stacked by detail. A sharper layer only enters when it covers the entire frame. That way, you never see a crop edge.
HUD
Display derived from the km
Country (switch at the end of the ferry and at the border), road (from OSRM steps), altitude (SRTM interpolated), and car direction all come from the same km. Pins and labels have anti-collision and disappear when zooms out.
Cards and sounds are not in render(): they are elements with data-start/data-duration (HyperFrames tracks), generated from trip.js. The music and effects (whoosh, stamp, ship horn) also have a fixed schedule, synced to the beat.py.
5 · Two versions of the engine
v1 · trajeto-hua-hum/
The first one, custom-made for 54 km of mountain with two cars. Own scripts (build_route.py, build_map.py, gen_cars.py) and water.py, which repaints the lakes with OSM water polygons to remove satellite reflections.
v2 generic · volta-defender/, ida-defender/
Made for long trips: legs + ferry + border by configuration (trip.json), satellite in layers by stop. The return re-used the outbound engine and cost less than half.
6 · 9:16 and 16:9 with the same code
The index.html has two marked blocks, /*LAYOUT-CSS-START*/ and /*LAYOUT-JS-START*/ (frame size, card positions, fonts). make_16x9.py copies the project by swapping only those blocks; assets enter via symbolic link.
Prerequisites
What you need on the machine
Everything runs locally. The used APIs (OSRM, Overpass, OpenTopoData, Esri, Wikipedia, Commons) are open and have no key.
Node + HyperFrames
To preview and render. The version is fixed in the package.json of each project.
npx --yes hyperframes@0.8.72 --help
Python 3
For the data scripts: numpy and Pillow.
pip install numpy pillow
ffmpeg
Used by beat.py, by the share render (−14 LUFS), and by the version ≤ 44 MB.
ffmpeg -version
Usage guide · step by step
Run a ready trip or make a new one
The data for the three trips is already in the repo. To view and render, you just need steps 1, 5, and 6. For a new trip, copy ida-defender/ and redo steps 2 to 4.
1
Clone and open a trip
The HyperFrames preview opens the frame in the browser, with the timeline to drag.
git clonehttps://github.com/inematds/expedicaosulcd expedicaosul/ida-defender
npm run dev # = npx hyperframes preview
2
Assemble the route
Save the OSRM route for each leg (osrm_A.json, osrm_B.json), the ferry line (ferry.json), and describe legs, border, and stops in trip.json. Separated legs anchored at the ends of the ferry prevent OSRM from taking the route overland.
Measured in the Claude Code session logs (tokens per call), in API-equivalent dollars. If you use it by subscription, you don’t pay this value per usage; it’s for comparison.
Video
Agent time
AI cost (US$)
Magnific credits
Hua Hum 9:16
55 min
13.12
190
Hua Hum 16:9
~5 min
1.07
—
The return trip (9:16 + 16:9)
38.5 min
15.18
180
The outbound trip (9:16 + 16:9)
24.4 min
6.85
160
Total
~2h03
36.22
530
98–99.5% of the input came from cache. The return trip paid for building the generic engine; the outbound trip only reused. Image (flux2-klein) and renders (HyperFrames) ran locally, with no cost. Details in README.
Status
What’s done and what’s still manual
For anyone who wants to reuse the engine.
Done
3 trips, 8 videosHua Hum (v1 engine), the return and outbound trips (generic v2 engine) and “our plan × our adventure” (3 panels, trip photos), in 9:16 and 16:9 — the latter also in English and Spanish.
Manual
Download the OSRM legs and write the trip.jsThere is no script that reads the Google Maps link; the legs and the schedule per stop are assembled by hand (today, by the agent).
Manual
Choose photosThe script searches and assembles contact sheets; the choice, verified by location, goes to picks.json.
Outside git
Masters 60 fps and tile cacheThe masters (300+ MB) and the satellite/photo caches are not in the repository; the repo carries the web version.