youtube-bombando · free project · runs on your computer · no key

The trending radar: find out every morning what is blowing up on YouTube in your niche, and why

You record, you put in the effort, and the video goes nowhere. Meanwhile, a small channel on the same topic gets hundreds of times its usual views. The trending radar shows you, before you record, what is growing and whether it grew because of the topic (you can use the idea) or just because the channel is big (you can't).


The trending radar — find out every morning what is blowing up on YouTube in your niche, and why
In short

youtube-bombando is a small system that runs by itself on your computer every morning. It searches YouTube for the week's videos on the topics you choose, records each one's views for 7 days and builds a panel showing what is growing fastest. For each video, it compares the views with the channel's own usual numbers and tells you whether the signal comes from the content, from who posts (a big channel) or from who speaks (a guest). It's for people who make videos or want to start a channel. All it needs is Python and a free tool that reads YouTube; no key, no paid API.

The trending radar: hot topics, hottest per niche, growth chart, why it blew up, burst the bubble, every day at 7:15 AM
The video

The radar in 2 minutes

Watch the project explained (in Portuguese). Prefer vertical? Watch the Short

The panel

What you see every morning

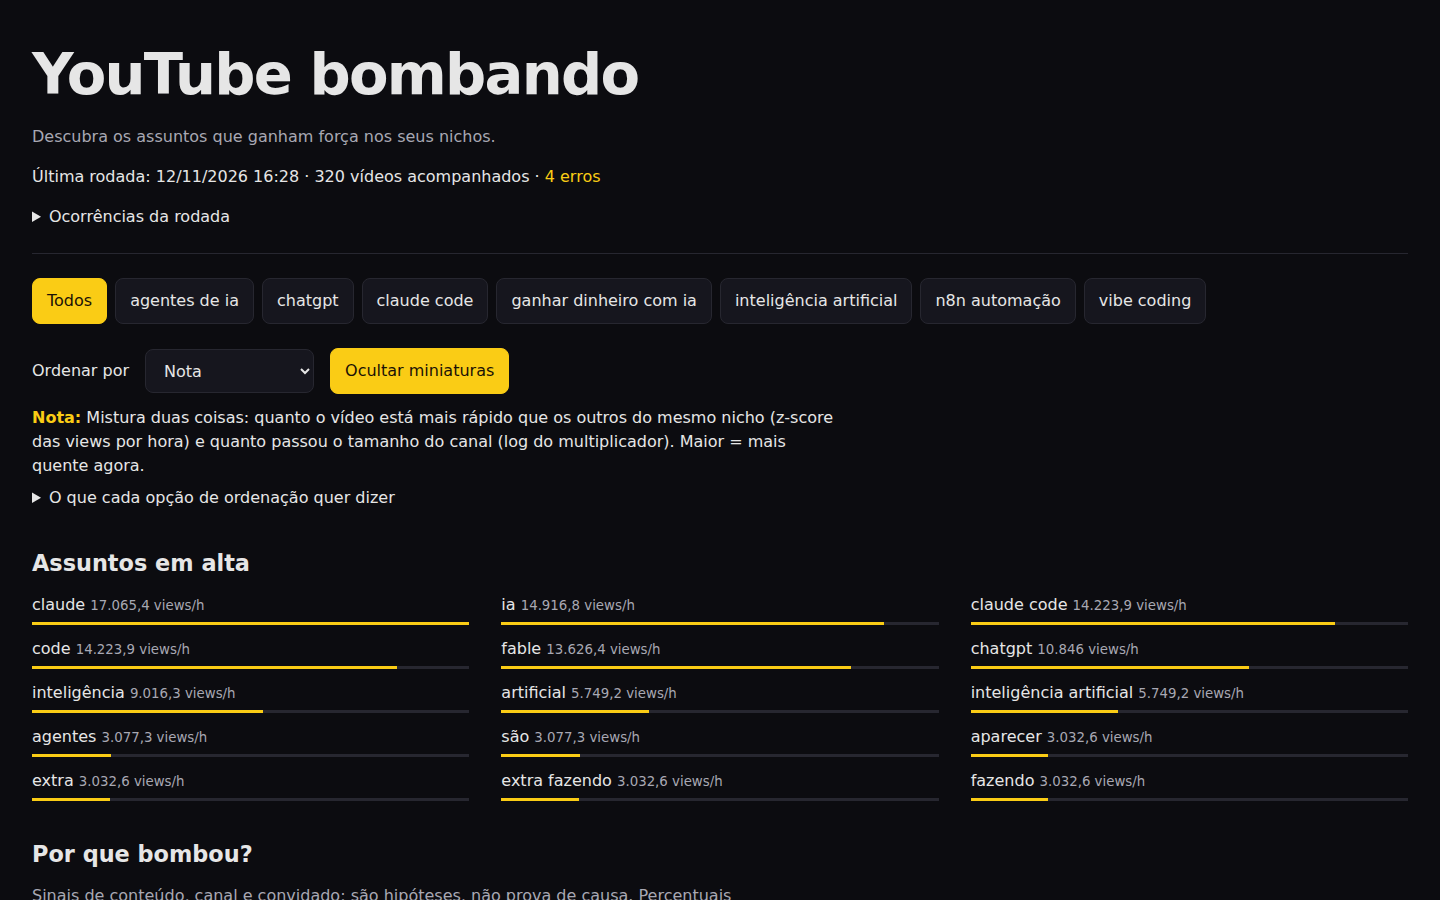
At 7:15 AM the collection finishes and the panel updates by itself. You pick the topic at the top and the order of the videos; each sort option is explained below the selector.

Top of the panel: topic filter, sort by with explanation, and hot topics
Hot topics. The words that show up most in the titles of the fastest-growing videos. The bar shows the weight (views per hour added up).
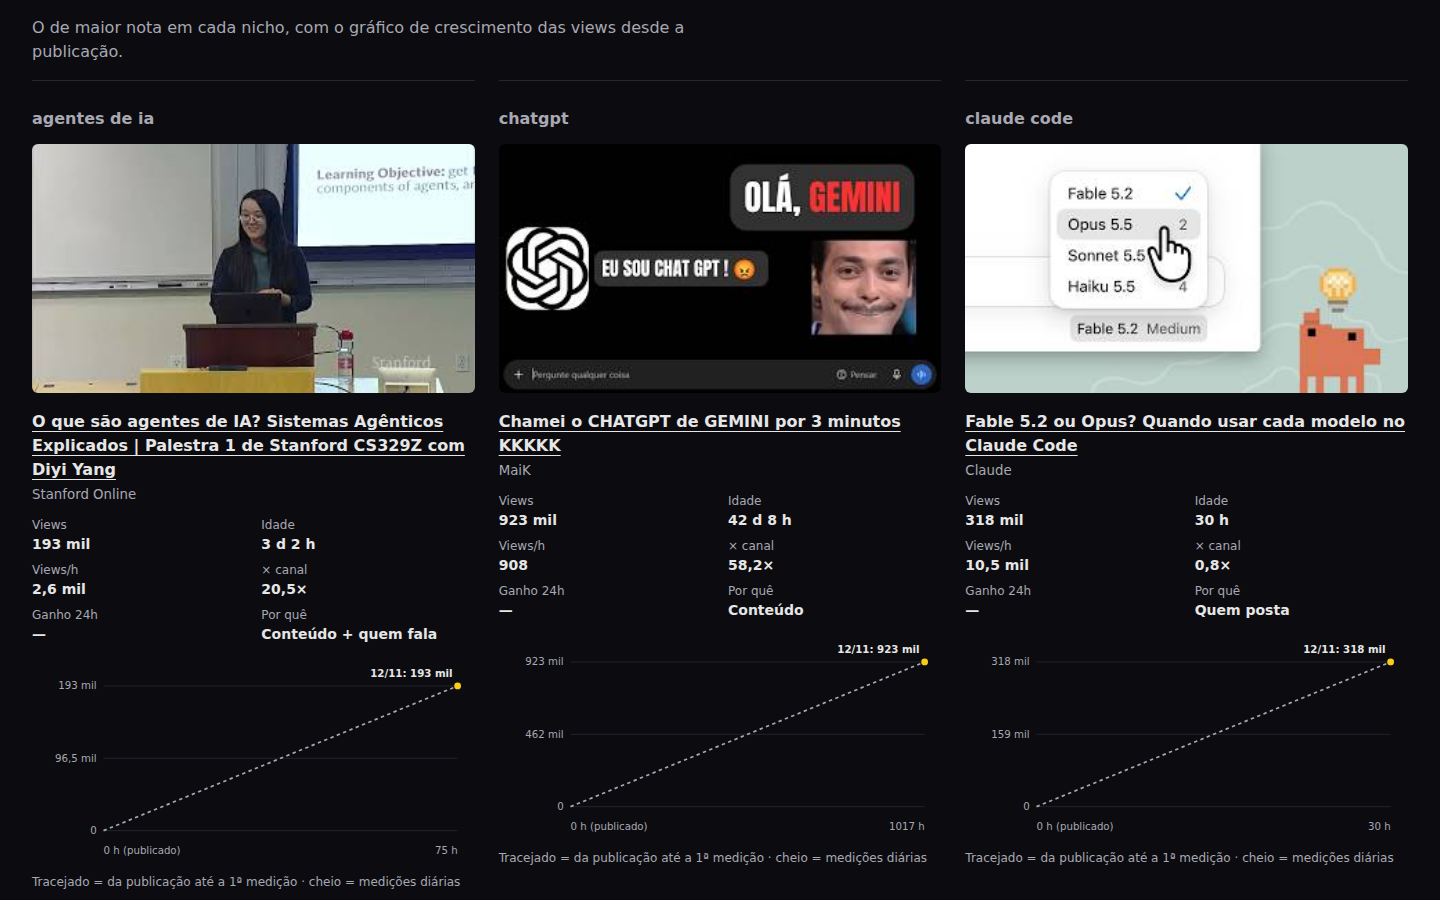
Hottest video in each niche, with thumbnail, numbers and chart
The hottest in each topic. Thumbnail, views, age (time since it was published), views per hour, how far it beat the channel's usual numbers, and the growth chart.
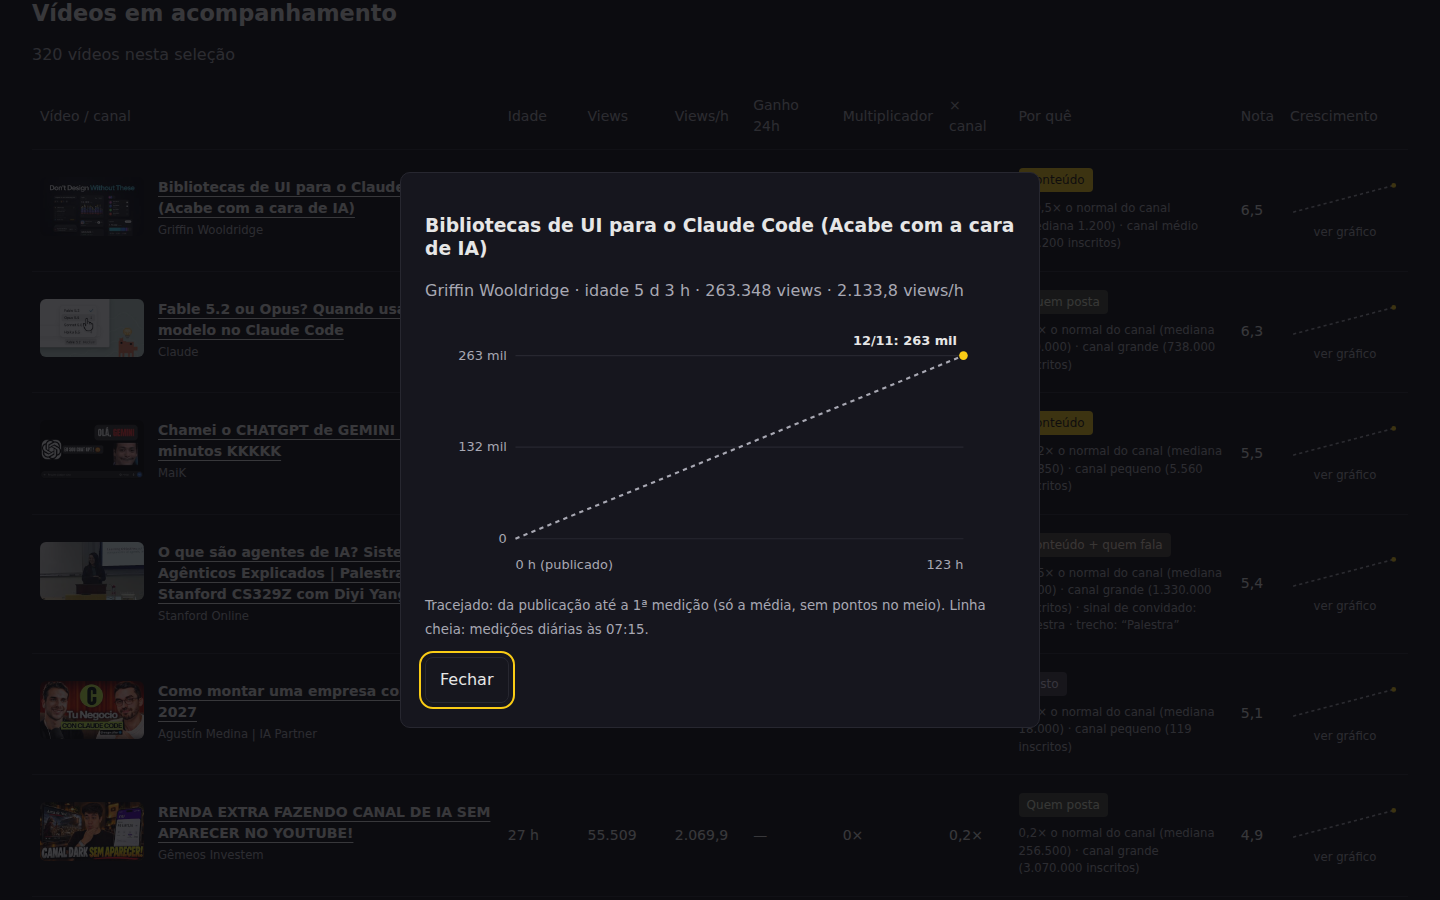
Growth chart of a video: views by hours since publication
Growth chart. Views (vertical) by hours since publication (horizontal). The dashed line goes from publication to the 1st measurement; the solid line connects the daily measurements.
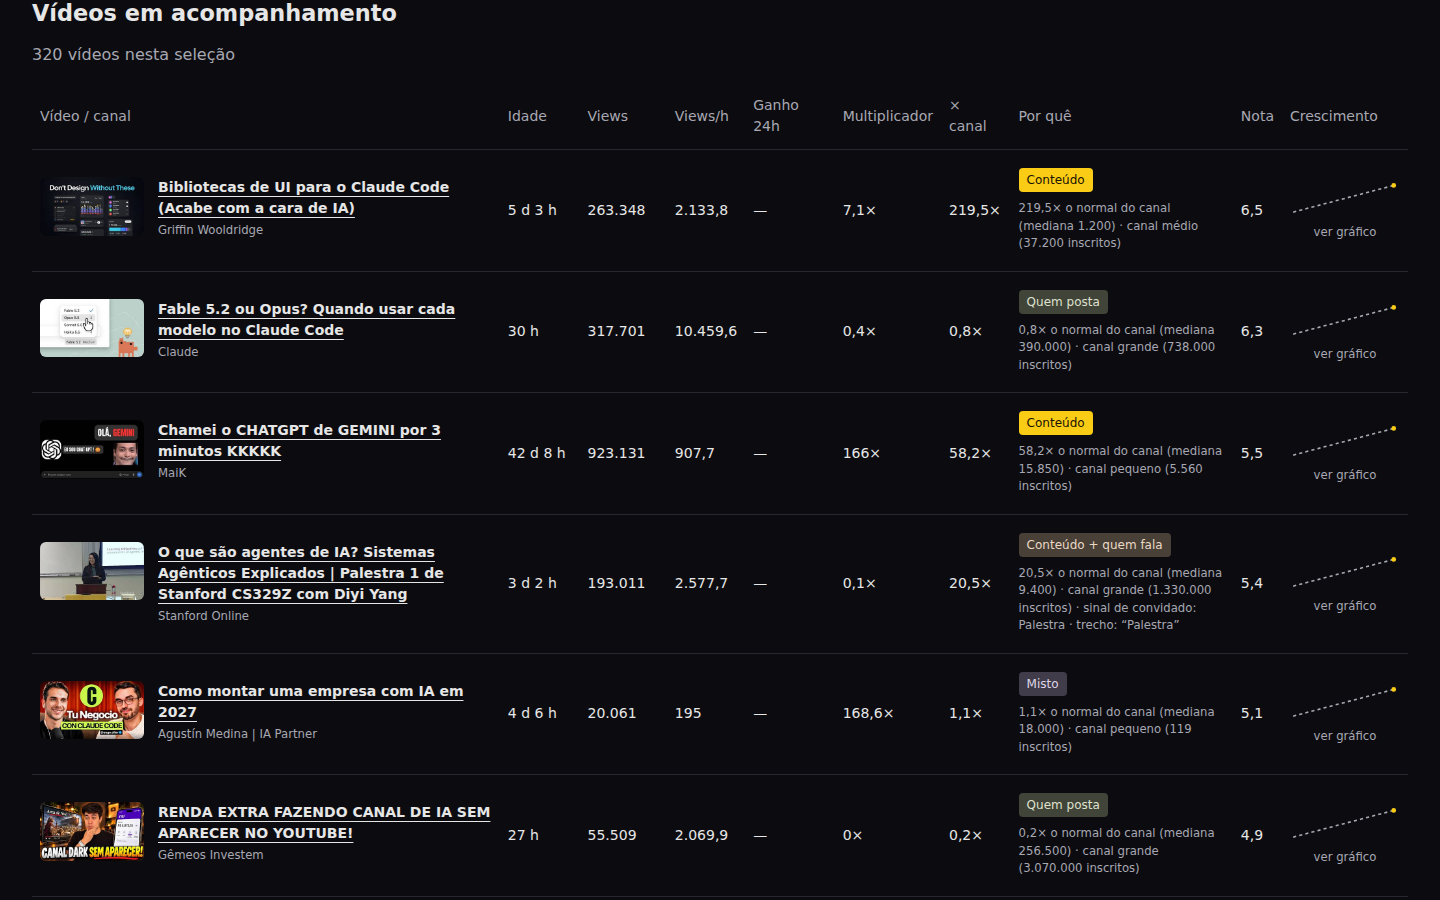
Table of tracked videos with age, views, views per hour, multiplier and why
All videos. Click “see chart” on any row to open that video's growth.
Sort byWhat it means
ScoreThe hottest right now: how much faster the video grows than the others on the same topic, plus how far it went beyond the size of the channel.
SpeedViews per hour since publication. Favors new videos.
24h gainViews gained since the previous day's measurement (shows up from the 2nd day of collection).
MultiplierViews ÷ subscribers. Above 1× the video reached more people than the channel has subscribers.
× channelViews ÷ the usual numbers of the channel's own latest videos. 3× or more = burst the channel's bubble.
ViewsTotal views, regardless of age or channel size.
NewestThe most recently published first.
Why did it blow up?

Was it the topic, the channel or who speaks?

A video with 1 million views on a channel with 5 million subscribers teaches you nothing: the audience was already there. The same million on a channel with 7 thousand subscribers teaches a lot. That's why the panel compares each video with the channel's own usual numbers (the median of its latest videos).

🟨 Content

Got 3 times or more the channel's usual. The topic pulled it. This is the idea worth studying and doing your own way.

🏢 Who posts (the channel)

A big channel (over 500 thousand subscribers) at its usual pace. The audience already existed; copying the topic won't bring the same result.

🎙️ Who speaks (the guest)

There's a guest (interview, podcast, talk or a well-known name) and it beat 1.5× the usual. The person pulled it.

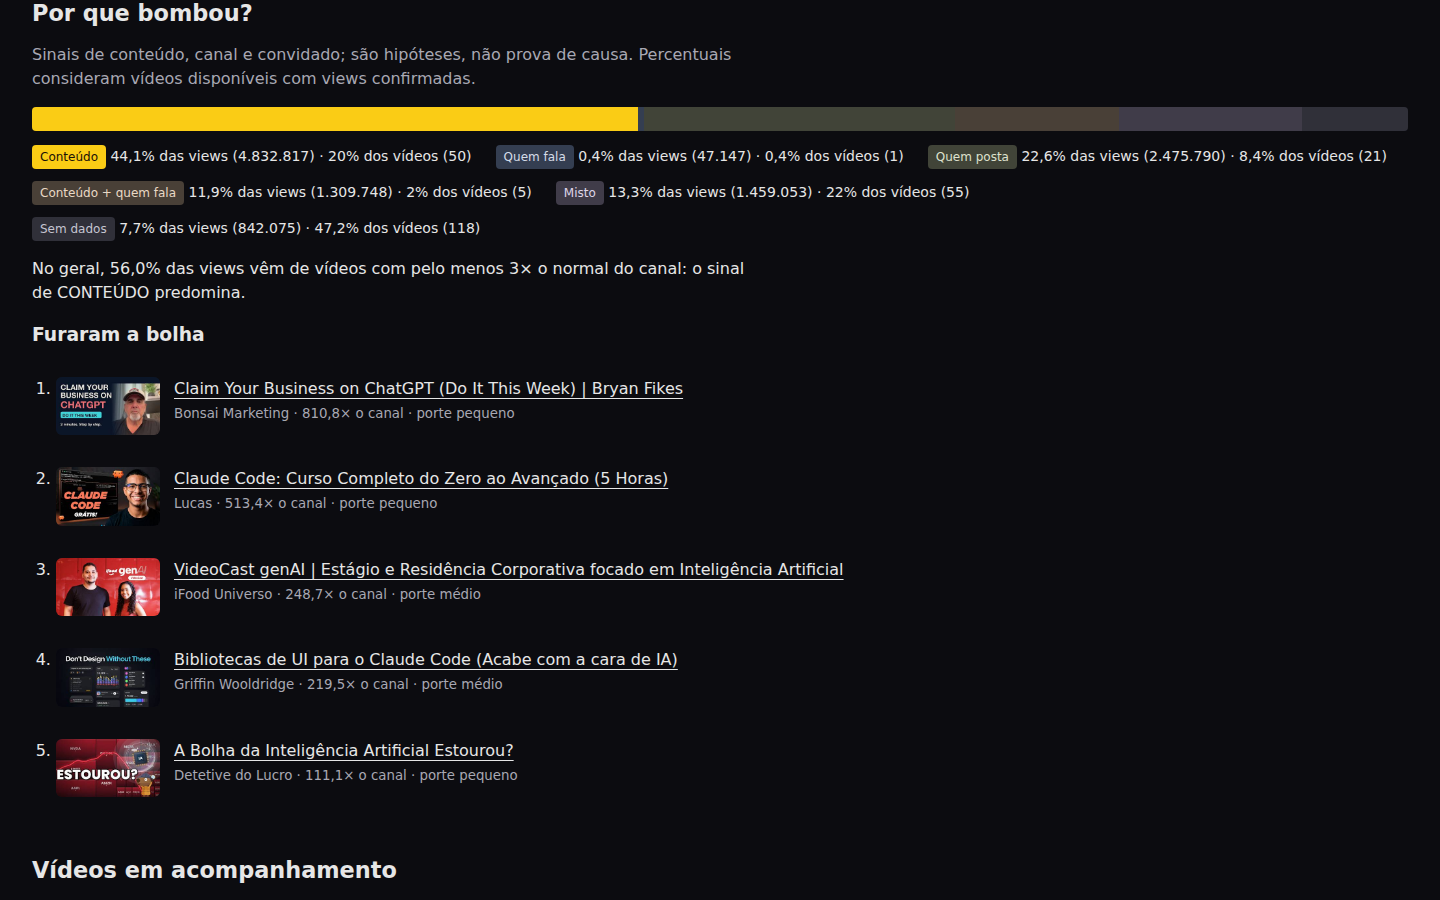
Why did it blow up section: bar splitting the views between content, who speaks, who posts, mixed and no data; Burst the bubble list

It's a signal, not proof of cause: simple math (views ÷ the channel's usual), no AI. When the channel has no baseline yet, the video goes under “No data”, never a guess.

The finding from the 1st collection (Nov 12, 2026)

Overall, content rules

320 videos across 7 topics (artificial intelligence, n8n, claude code, AI agents, vibe coding, making money with AI, chatgpt).

56%

of the views came from videos that got 3× or more their channel's usual.

23%

of the views came from big channels at their normal pace (who posts). On the “artificial intelligence” topic, 31%.

810×

the biggest jump of the day: a small channel got 810 times its usual. A 5-hour course on a channel with ~7 thousand subscribers got 513×.

These numbers change every day; the panel shows today's.

How to use the idea

From the panel to your next video

1
Look at “Burst the bubble” (“Furaram a bolha”: the panel itself is in Portuguese)These are small and mid-size channels that did far better than usual. Their topic and format are the best models to study.
2
Check the hot topics in your nicheFilter by your topic. Words that appear in several fast-growing titles point to a hot theme this week.
3
Ignore “who posts”A big channel's video at its normal pace shows the strength of the channel, not of the topic. It's not a reference for you.
4
Follow the chart for a few daysFrom the 2nd day on you get the 24h gain and the real curve. A topic still climbing on day 3 still has room.
5
Swap the topics for your nicheRecipes, finance, fishing, makeup: just change the list of topics. how to use ↓
Technical part

The kit: for those who want to run the radar

From here down is the technical part: install it, choose the topics and leave it running every day. You don't need this part to understand everything above.

What it is

A daily radar, no key and no API

🔎 Collection

Uses yt-dlp (a free, open tool) to find the week's videos for each topic and read the views, just like a browser would. Pauses between calls and a cap per run.

📈 Metrics

One snapshot per video per day in a local SQLite database: speed, 24h gain, multiplier, × channel and the score. All explained in the README.

🖥️ Panel

A single index.html that opens in any browser, served on port 8795. It can also show up inside another panel (INEMA shows it in a “Network trends” card).

How it works

Every day at 7:15 AM

Week's search per topic→ Views of each video (1 snapshot/day)→ Each channel's usual→ Metrics + why it blew up→ Panel

Each video is tracked for 7 days from when it was found. Each channel's baseline (latest 20 videos) is kept for 7 days. The first full collection took about 20 minutes.

Requirements

Python 3 and yt-dlp

No key, no extra Python package. The automatic schedule uses Linux systemd; on Mac and Windows you run the collection by hand (or with the system scheduler).

🐍 Python 3.9+

python3 --version

📥 yt-dlp

Install it and keep it up to date (YouTube changes and yt-dlp keeps up).

# recent Ubuntu/Debian
sudo apt install pipx && pipx install yt-dlp
pipx ensurepath
# then close and reopen the terminal
# other systems
python3 -m pip install -U yt-dlp
yt-dlp --version

📦 The project

No git: download the ZIP.

# no git? sudo apt install git
git clone https://github.com/inematds/youtube-bombando
cd youtube-bombando
# downloaded the ZIP? the folder is youtube-bombando-main
User guide · step by step

Step by step

1

Test without internet

The tests and a run with sample data, without touching YouTube. The test panel goes to dados/teste/painel/. The expected ending is rodada ok: 7 nichos, 3 novos, 2 fotos, 1 erros: that 1 error is on purpose (a sample private video).

python3 -m unittest discover -s tests
python3 bombando/rodada.py --fixtures tests/fixtures
# open dados/teste/painel/index.html in your browser
2

Choose your topics

Edit config.json. Each topic has a name, the search term and whether it's active. The "nichos" list comes with 7 AI topics: replace them with yours or set "ativo": false on the ones you don't want. Comma between items, none after the last one; leave the rest of the file as it is.

{
  "nichos": [
    { "nome": "easy recipes", "busca": "easy recipe", "ativo": true },
    { "nome": "desserts", "busca": "easy dessert", "ativo": true }
  ],
  …
}
3

Run the first collection

It can take from a few minutes to half an hour, depending on the number of topics. For a single topic, use --nicho.

python3 bombando/rodada.py
python3 bombando/rodada.py --nicho 'easy recipes'
4

Open the panel

The panel is a single file. Open it directly or serve it on port 8795. No server: double-click painel/index.html. It stays empty until the first collection finishes.

python3 -m http.server 8795 --directory painel
# http://localhost:8795
5

Leave it running every day (Linux)

Installs the 7:15 AM schedule and the panel server as services for your user. Safe to run again. The computer must be on and you logged in; if it was off at 7:15, the collection runs as soon as you turn it on and log in. The panel is visible to other devices on your home network (port 8795).

bash deploy/instalar.sh
systemctl --user list-timers youtube-bombando.timer

To check that the automatic collection ran: journalctl --user -u youtube-bombando. To turn everything off: systemctl --user disable --now youtube-bombando.timer youtube-bombando-painel.service.

6

Just rebuild the panel

Without collecting anything, for example after changing something in the look.

python3 bombando/rodada.py --so-painel
Roadmap

Next steps

Today · 1.2
Radar, why it blew up and growth chart7 topics, daily panel, hottest video with numbers, explained sorting, 33 tests.
Next
Trend of the weekWith more days of collection, compare this week's topics with last week's.
Later
Alert when a video explodesA message when a video in your topic goes past a × channel limit.