Track map
Detailed content
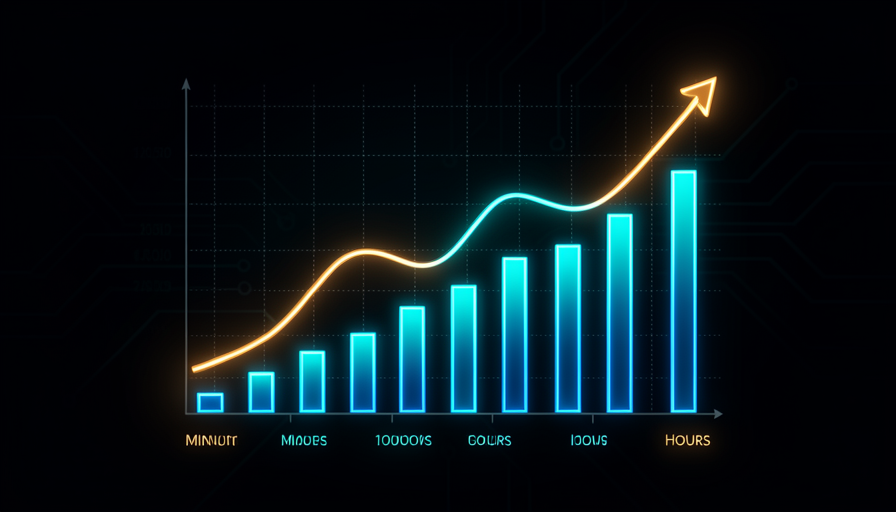
📊 The METR curve: the task horizon
The measure that turns “AI is getting better” into a number: the largest task, measured in human time, that a model completes alone.
The largest task—measured by how long a human would take—that the model completes with about a 50% success rate. This is how METR (an independent organization that evaluates the capabilities and risks of frontier models) puts a number on “how capable.”
Without a measuring stick, “AI has improved” is an opinion. With a task horizon, it becomes a curve we can track month by month.
METR; task horizon; 50% success rate; human time as the unit.
The sequence of measurements from Mar 2024 to 2026: the horizon grows from a few minutes to more than half a workday. Each step is a measurement from the suite, not a guess.
The shape of the curve is at the heart of the warning: it is not just rising, but how fast it is rising.
Progression; steps; growth rate; observed trend.
METR itself warns that above 16 hours, measurements from that suite were no longer reliable. “16 h” is the instrument’s ceiling, not the model’s limit.
This is the kind of detail that separates careful reading of a chart from turning a number into a misleading headline.
Test limit × model limit; measurement ceiling; honest interpretation.
Recursive self-improvement does not require solving everything instantly; it requires a useful worker for hours and days at a time. That is exactly what a long horizon means.
This connects the curve to the course topic and sets up MirrorCode (Module 2.2), where AI runs for days.
Long horizon; extended autonomy; bridge to RSI.
It is measured by running the model on many tasks of known durations and finding where it succeeds about half the time. There is variability, and near the top the test reaches its own limit.
Understanding the method guards against two mistakes: dismissing the curve as “marketing” or treating it as clockwork precision.
50% rate; variance; measurement noise; suite limit.
Extending the chart’s line into the future does not make the outcome certain. The trend is solid; the arrival date is speculation. The two must not be conflated.
This is the course’s honest stance: take the evidence seriously without buying the prophecy attached to it.
Extrapolation; trend × destiny; solid evidence vs. hype.
🪞 MirrorCode: rebuilding in the dark
The benchmark that asks about real scale: what is the largest software project AI can rebuild on its own with only the executable and documentation.
A benchmark (a standardized test for comparing models) developed by Epoch AI with METR. The AI receives a program as a “black box”—only the executable and documentation, without source code—and must rebuild the software from scratch.
It complements the curve: not “how long can it keep going?” but “what size project can it finish?”
Benchmark; black box; reconstruction; Epoch AI + METR.
The test’s direct question: what is the largest software project AI can complete without a human? It covers 25 real programs—from bioinformatics and Unix utilities to cryptography and interpreters.
“Alone” and “real project” are the two words that separate a demo from serious capability.
25 real programs; end-to-end task; no human assistance.
A bioinformatics toolkit with ~16,000 lines of Go and 40+ commands. AI reimplemented it, passing 99.95% of tests in 14 hours for about US$251—a human would take 2 to 17 weeks (Epoch estimate). Figures are from the video and need verification.
This concrete example makes the benchmark tangible—and shows why separating solid evidence from claims to verify matters.
gotree; 99.95% of tests; human-effort estimate; figure to verify.
One run operated continuously, with no human at the controls, for about 19 days (≈ US$2,600). It is the Module 2.1 curve made real: autonomy for days, not minutes. Figures are from the video and need verification.
It shows what “long horizon” means in practice and why it is the missing piece for RSI.
Continuous run; 19 days; compute cost; long-term worker.
The best model solves about 56% of the benchmark—leading the field, but not replacing engineers across the board. A year earlier, top models scored about 30% on simpler programs. Version name and figure need verification.
At 56%, the result is both impressive and incomplete—this module asks you to consider both sides.
Solve rate; leadership ≠ perfection; jump from ~30% to ~56%.
The concept and benchmark are well established. Exact model versions and specific figures (251, 2,600, 56%) come from a single source—treat them as claims until checked against a primary source.
This closes the track with a method: take the evidence seriously and label each figure by its level of certainty.
Solid evidence × claim; primary source; productive skepticism.