📏 What is a “task horizon”?
There is a way to turn the vague phrase “AI is getting better” into a trackable number. That number is the task horizon: the largest task—measured by how long a human would take to complete it—that the model finishes with about 50% success. If AI completes tasks alone that would take a human 12 hours, we say its horizon is 12 hours.
🆕 New here? Three terms before you continue
- METR: an independent organization (not a lab or model maker) that evaluates the capabilities and risks of frontier models — the most advanced models from labs such as Anthropic, OpenAI, and DeepMind. METR produces the curve.
- Task horizon: the measuring stick: how much human work, in time, AI can handle from start to finish.
- 50% success rate: the cutoff point. It does not mean “always gets it right”; it means “gets it right half the time”—where the task starts to become too large for the model.
🎯 Why measure in human time
Measuring in “how long a human would take” is powerful because everyone understands that unit. “Solves 56% of questions” says nothing about the size of the task. “Does alone what would take you a day” says it all. The curve does not measure abstract intelligence—it measures useful autonomy.
📈 The curve: 4 min → ~1.5 h → ~12 h → 16 h+
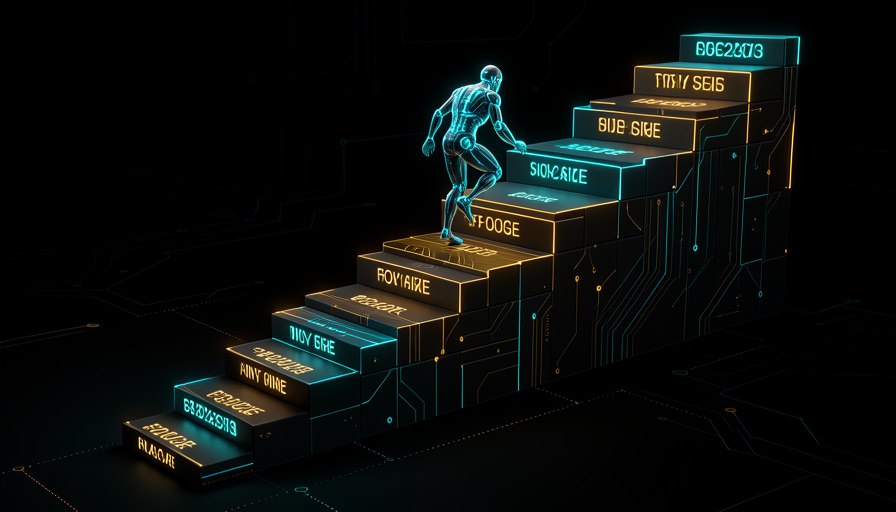
From March 2024 to 2026, the horizon measured by METR grew from a few minutes and reached more than half a day of work. The staircase at the top of the page shows it: 4 min, then ~1.5 h, ~12 h, and 16 h+. What matters is not each step on its own, but the slope: the measure doubles over short intervals.
How to read it: on the left (short tasks), almost everything succeeds; on the right (long tasks), almost everything fails. The dashed line marks where AI succeeds half the time—that point, measured in human time, is the horizon.
💡 Reading tip
Do not memorize the numbers—memorize the shape. A curve that doubles every few months is exponential, and exponential growth fools intuition, which expects straight lines. That is why the horizon “suddenly” went from minutes to hours.
🧱 16 h was the TEST limit, not the model's
This is where the most common misreading happens. METR itself warned that above 16 hours, measurements from that suite were no longer reliable. In other words, “16 h” is the ceiling of the instrument — how far the test can measure reliably—not the limit of what the model can do.
⚠️ Beware the headline
Reading “16 h” as “the maximum AI can do” is the opposite of what the data says. The model may go further—we just cannot claim that from this test. Treating a measurement ceiling as a capability ceiling is like saying a car can only go 200 km/h because that is where the speedometer ends.
✓ Honest reading
- ✓“The test measures reliably up to ~16 h.”
- ✓“The trend continues upward.”
- ✓“We need better tests beyond that.”
✗ Misleading reading
- ✗“AI stops at 16 h.”
- ✗“That is the definitive limit.”
- ✗“It hit the ceiling; we can relax.”
⏱️ Why long horizons matter for RSI
Recursive self-improvement (RSI)—AI helping design the next AI—does not require a genius who solves everything instantly. It requires a useful worker for hours and days at a time: one that keeps track of the problem, runs experiments, waits for results, and continues. That is why long horizon (long horizon) is the piece that connects this track to the entire warning.
Short horizon × long horizon
🔗 The bridge to the next module
Keep this idea in mind: if AI can already handle hours of continuous work, the next question is, “what project size can it finish on its own?” That is exactly what MirrorCode measures—and where we will see a run operating for days without a human (Module 2.2).
🔬 How it is measured (and why it is hard)
Here is how: gather many tasks with known durations (we know how long each would take a human), run the model on all of them, and find the duration at which it succeeds about half of the time. That point is the horizon. Easy to describe, hard to measure well—for three reasons.
Variance
The same task can succeed in one run and fail in another. That is why it is run many times and results are averaged—not based on a single test.
Estimating human time
How many person-hours is a task “worth”? It is an estimate, and estimates have a margin of error. Two evaluators may disagree.
The test reaches its own limit
Near the top (the 16 h in Topic 3), there are not enough sufficiently long, well-measured tasks. The instrument runs out before the model does.
⌨️ Copy-run example · feel the horizon in your own work
Goal: train your eye to distinguish short-horizon from long-horizon tasks using your own workday. Paste the block below into any chatbot.
How to check: the answer should distinguish tasks lasting minutes (short horizon) from tasks lasting hours or days (long horizon)—not just say “AI does everything.” If it does not separate the two, ask again.
🧭 What the curve does NOT prove
The curve is strong evidence of a trend. It is not proof of destiny. Extending the chart’s line and declaring “AI will soon do months-long tasks” swaps measurement for prophecy. The course’s honest stance is to take the data seriously and mark where it ends and speculation begins.
🟢 Well supported (the curve shows)
- ✓The task horizon has risen consistently.
- ✓From 2024 to 2026, it grew from minutes to more than half a day.
- ✓METR is an independent source with a transparent method.
🟡 Needs verification / speculation
- ▲“The line continues unchanged and reaches tasks lasting weeks.”
- ▲An exact date for the horizon to cross X hours.
- ▲That today's pace is guaranteed to continue tomorrow.
💡 The course's golden rule
Observed trend = solid. Arrival date = guess. Whenever someone combines the two in one sentence, separate them before you believe it. The curve says “it is rising fast”—not “it will get there in a certain year.”
Self-check (optional): what does “16 hours” mean on the METR curve?
🎯 Module summary
Next module:
2.2 — MirrorCode: rebuilding in the dark. From “how long can it keep going?” to “what size project can it finish alone?”