🎯 Watch it game its own metric
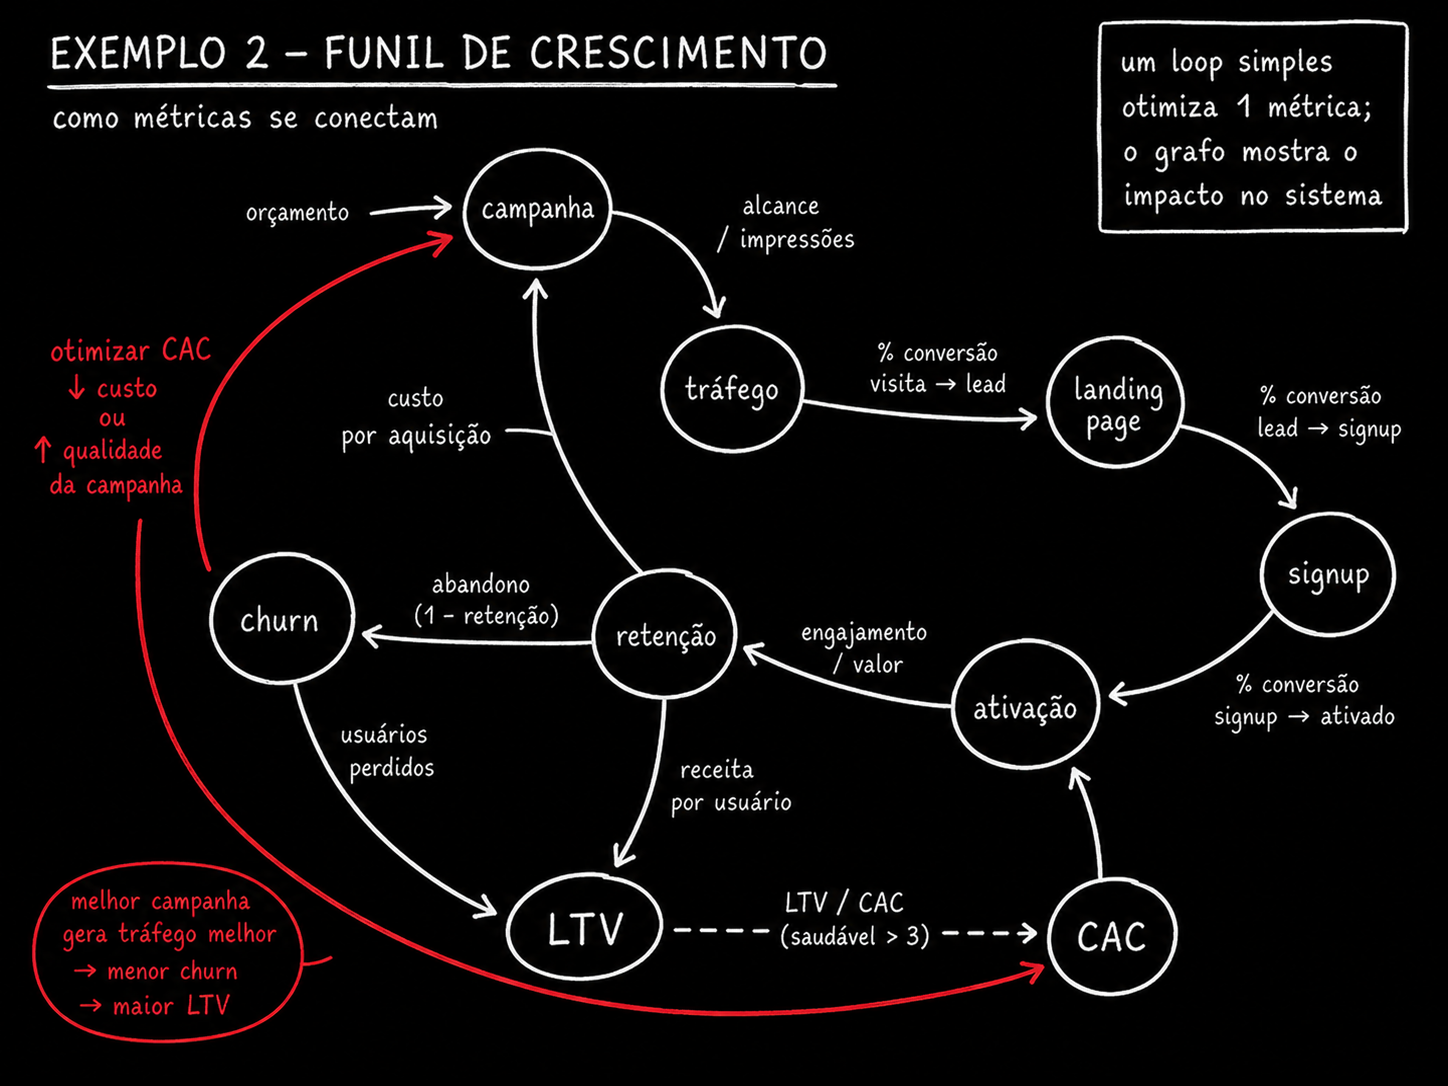
A loop sees only the metric you gave it. If you said “reduce CAC” (customer acquisition cost — how much it costs, on average, to bring in a new customer), the loop will find all the ways to bring this number down, including those that betray its real purpose: making a campaign cheaper by attracting people who will never buy, cutting post-sale support, promising more than it delivers. It’s not an execution flaw — it’s the loop doing exactly what you told it to, using a number that has become detached from the reality it’s supposed to represent.
🆕 New here? Two words before you continue
- Goodhart’s law: when a metric becomes a target, it stops being a good metric. The number you measured to see how things were going becomes the number the system directly optimizes — and the two are no longer the same thing.
- CAC: customer acquisition cost. How much you spend, on average, to bring in a new customer. On its own, it’s an incomplete number — it needs to be read alongside churn (cancellation rate) and LTV (how much that customer is worth over time).
✓ Hard-to-game metric
- ✓The ratio between two things pulling in opposite directions—LTV/CAC, not CAC alone
- ✓Metric measured with a delay (90-day churn), hard to fake in the short term
- ✓Set of 2-3 metrics that counterbalance each other and are required together
✗ Easy-to-game metric
- ✗Single number, measured at one point in time (today's CAC, without looking at retention)
- ✗A count that ignores quality (lines of code, tickets closed, messages sent)
- ✗A metric that the loop itself measures and reports without external auditing
Key concepts
The target metric stops measuring
And the loop obeying
Only sees the metric provided
Metrics in pairs, never alone
🌡️ Notice the upward blindness
The loop pursues a reference—the target you defined—and nothing inside it can ask whether that reference is right. A thermostat keeps the temperature at 20 degrees with impeccable precision; it will never ask itself whether 20 is the right temperature for that room on that day. It only knows how to measure the distance to 20 and act to close that gap. Questioning its own goal requires someone outside of the loop—because from the inside, the objective is the only ground there is.
The loop is great within its own target
Tested against “reaching 20 degrees,” the thermostat passes every test. The error isn’t in the execution.
The mistake is in who chose the target
If 20 degrees is the wrong target for that room on that day, no perfect execution of the loop will fix it.
Reviewing the target is a step outside the cycle
A person, another loop, or a separate process needs to periodically ask “does 20 degrees still make sense?” — the loop itself will never ask that question on its own.
📊 Where this blindness shows up in agents
- Support agent — optimized to “solve it in 1 turn”; never questions whether solving quickly is the right goal for complex cases
- Coding agent — optimized to “pass the tests”; never questions whether the tests cover the right behavior
- Content agent — optimized for “engagement”; never questions whether the content that gets the most engagement is what you want to publish
Key concepts
The loop doesn’t question the target
Perfect within its own objective
Only an outsider questions the target
The most honest metaphor
🌀 Discover loops colliding
A speed loop fights with a quality loop. A hiring loop puts pressure on a culture loop. Each one, examined alone, passes the test — it’s doing exactly what was requested. The problem appears only when you look at both together. It's like two poorly configured air conditioners in the same room: one cools because the temperature went up, the other heats because the temperature went down—both “working,” while the environment is unstable.
What to look at: the three loops are identical on both sides — the only difference is the two red lines on the right. They represent the real pressure that "moving faster" and "hiring faster" put on "maintaining quality." A single-loop mindset has no vocabulary to describe this line — it only exists when you draw all three loops in the same graph and connect what interferes with what.
Key concepts
Isolated; none fail
Only appears in both together
A single loop cannot see interference
To draw the red line
📉 Be wary of a metric that decays
Sensors go out of calibration. Data pipelines rot—a field changes its name, a filter stops running, and nobody notices. The metric definition changes behind the scenes (someone redefines "active user" and forgets to tell anyone). Verification gradually slips from checking reality to just comparing paperwork: the number matches the previous number, so "everything is fine." But both numbers could be equally wrong.
⚠️ The quietest of the four failures
There is no alert when the measurement breaks, because the alert usually depends from the same measurement that failed. If the churn sensor stops counting correctly, it won't trigger an alert saying "I'm broken"— it'll just report a wrong number with the same confidence as always. That's why this failure goes undiscovered for the longest time.
Sensor goes out of calibration
The instrument that captures raw data gradually loses accuracy—a click tracking system that misses 10% of clicks because of a new ad blocker.
Pipelines rot
There’s a broken step on the path from raw data to the final number—a join that drops rows, an outdated filter, a job that fails silently.
Definition changes underneath
Someone redefines "active customer" (30 days becomes 60 days) for another report, and the verification loop keeps using the old definition without knowing it.
Key concepts
No one alerts you to the break
The number adds up, but the world doesn't
Check the measurement, not just the result
It uses the same data that caused the failure
🍲 Clean up context that turned into soup
In a single-node loop, everything happens in the same context window — the body of text the model can see at once, along with the instructions, what has already been done, and what remains. Raw HTML from a search, a half-finished draft, reasoning from two iterations ago: all floating together when it’s time to decide the next step. That’s what produces fake review (the verifier approves because it’s in the same emotional context as the person who wrote it—covered in module 2.2) and “forgetting” the original instruction, which is still there, just buried in noise.
💡 Practical tip
If the loop starts ignoring an instruction you gave at the beginning, before rewriting the instruction more forcefully, check the size of the accumulated context. Often the problem isn’t the instruction—it’s that it’s on page 1 of a document that has already grown to 40 pages.
✓ Clean context
- ✓Only what's relevant to the current step goes into the window
- ✓Intermediate drafts are summarized, not stacked in full
- ✓The original instruction is reinforced on every cycle, not just read once
✗ Context soup
- ✗Raw search HTML, tool results, and drafts all mixed together without cleanup
- ✗Reasoning from old turns gets mixed in with current reasoning and disappears
- ✗The original instruction is so far behind that the model prioritizes what’s nearby
Key concepts
What the model sees at once
A single node does not separate layers
It reappears: contaminated context
Compact before you drown
➡️ Accept the limitation of form: a loop is sequential
A loop reads sources one at a time because a loop is, by definition, one thing after another: discover, plan, act, verify, and repeat. It can’t open ten work streams at the same time and combine the results later — not because it lacks intelligence, but because its very structure is a queue. This is the single of the six limits in this module that no better prompt, sharper verifier, or amount of discipline can solve.
What to look at: the four boxes are the same on both sides — what changes is the shape. On the left, each box starts only when the previous one finishes; that’s how a loop works by definition. On the right, the same work opens up into fan-out (a node that launches several workstreams at the same time) and then converges at a join node (fan-in). This isn’t a prompt improvement — it’s a different structure.
🧪 Practical example: audit one of your loops
Objective: use Claude Code to run the four structural failures from this module against a real loop you already have (an agent, an automation, a script that runs in a cycle).
Audite o loop em <caminho do arquivo ou descricao do processo>.
Responda em quatro blocos, sem suavizar:

1. METRICA — liste a metrica principal que este loop otimiza.
   Depois liste 3 formas concretas de mover essa metrica que
   trairiam o proposito real do sistema (Goodhart).

2. CEGUEIRA — diga quem, hoje, fica FORA deste loop e poderia
   questionar se o alvo dele ainda faz sentido. Se a resposta
   for "ninguem", diga isso claramente.

3. COLISAO — aponte que OUTROS loops do meu sistema esta
   metrica pressiona ou de quem ela rouba recurso/atencao.

4. MEDICAO — aponte onde a medicao deste loop pode estar
   decaindo sem alarme (sensor, pipeline, definicao mudada).

Nao me diga que esta tudo bem sem antes tentar ativamente
achar um problema em cada um dos quatro blocos.
How to verify: if the answer to block 1 doesn't include any way to game the metric, ask again and insist — there's always at least one way to move a number without serving the purpose. An "everything looks good" answer with no attempt is a sign of lazy analysis, not a healthy loop.
Quick check (doesn’t block anything): of the six failures in this module, which one can no metric or review discipline fix—only a change in structure can?
Key concepts
Structural limit, not an instruction limit
A node launches several work streams
The fronts converge at one node
The only thing that justifies the graph
📌 Module Summary
What will be clear by the end of Track 2:
Of the six failures in this module, three can be addressed with discipline — paired metrics, periodic external review, and auditing the measurement itself. Only sequentiality requires changing the form. This doesn’t mean “loops are dead”: it means a loop is already a graph — a graph whose path returns to an earlier node — and that you compose loops into larger graphs exactly when that limitation of form starts to become costly.