☕ Model Your Morning
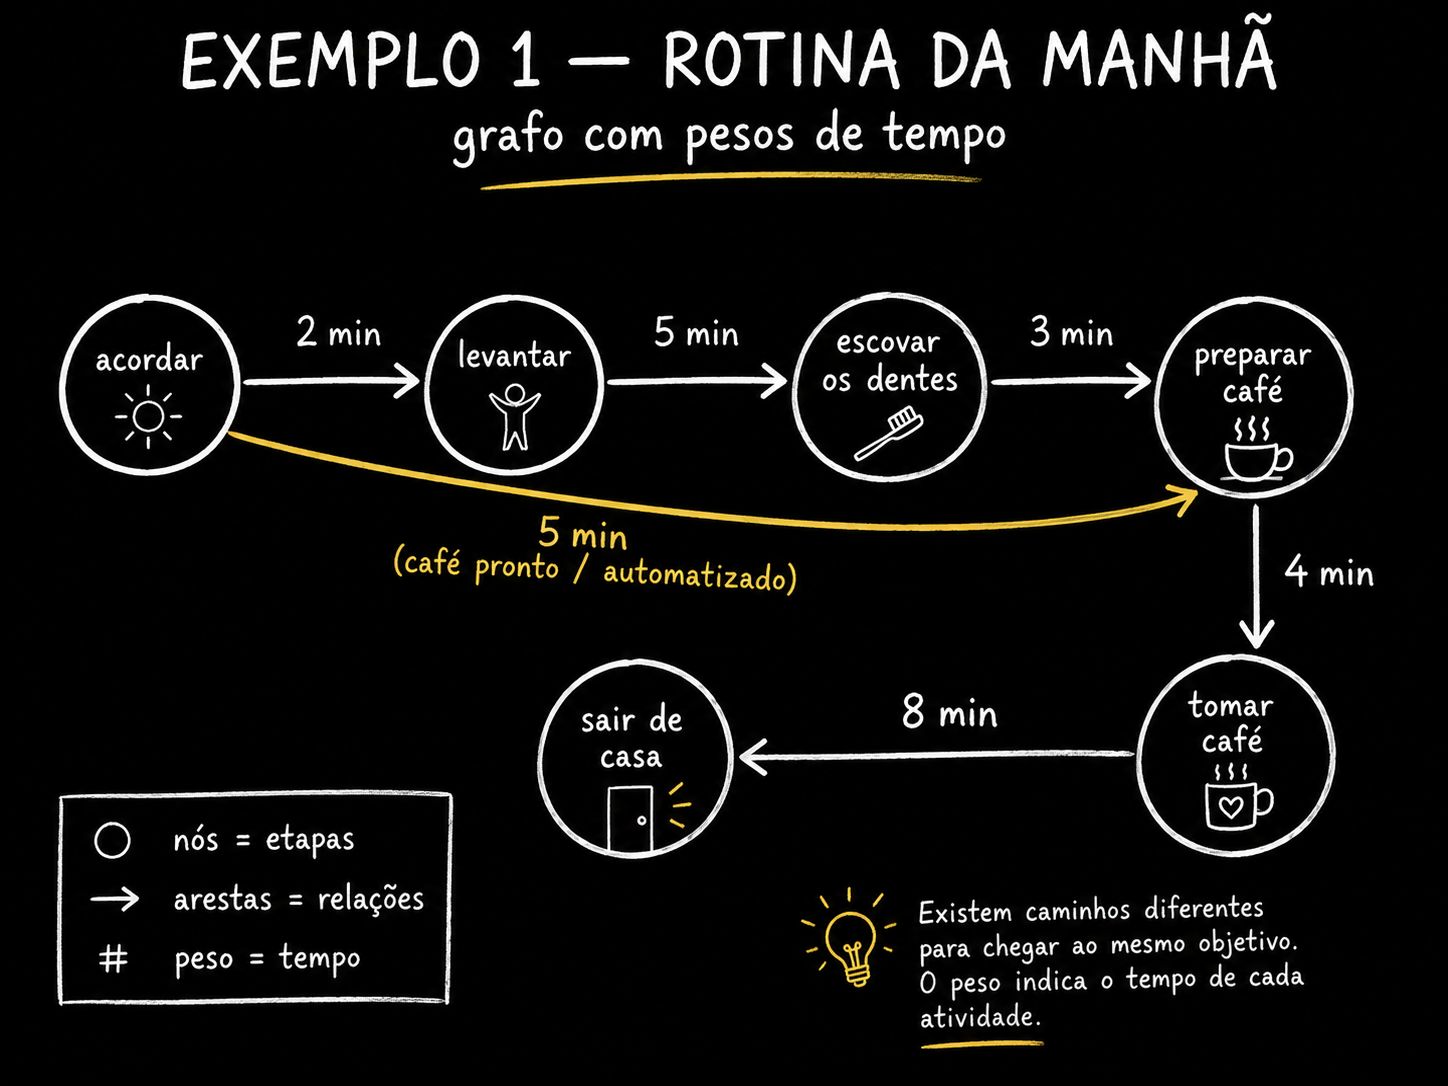
You sleeping. You wake up. It takes 2 minutes to get up. Another 5 to brush your teeth. Another 3 until coffee is in the cup. Each state is a at the, each transition is a edge, and each interval is the weight. You just modeled a process.
Things get interesting when a alternate path. Say someone (or a robot) brings you coffee in bed: now there's an edge that goes from “wake up” straight to “coffee,” skipping two nodes. The graph hasn't changed in nature— it just gained an edge. And suddenly, there's a choice to be optimized.
🆕 New here? What “modeling” means
Modeling is choosing what becomes a node, what becomes an edge, and what becomes a weight. There is no abstractly “right” modeling — there is modeling useful for the question you want to answer. If the question is “how long will it take,” the weight is minutes. If it's “how much does it cost,” the weight is money.
Key concepts
Where you are
How you get out of there
How much it cost
Where there's room to optimize
👥 Read the social graph
When LinkedIn says “you have 3 connections in common, add Lucas,” it’s giving you the result of a graph traversal. Each person is a node. Each relationship is an edge with a weight: friendship, coworkers, shared interests, other networks where you appear together. “Being three connections away” literally means three edges away.
What to look at: the numbers 1, 2, 3 above the lines. “Degrees of separation” isn’t a metaphor — it’s the number of edges in the shortest path. And each edge’s label (work, college, topic) shows that edges can have type, not just weight.
📊 What the algorithm does with this
- Recommend a person: who is 2–3 edges away and has many neighbors in common
- Recommend content: what the neighbors with high-weight edges consumed
- Community detection: groups where almost everyone is connected to almost everyone
- Find a bridge: the person who connects two groups that don’t know each other—the most valuable edge in the network
Key concepts
Distance in edges
The relationship has a name
Friendship goes both ways
The edge that connects worlds
📈 See the trade-off: CAC, churn, and LTV
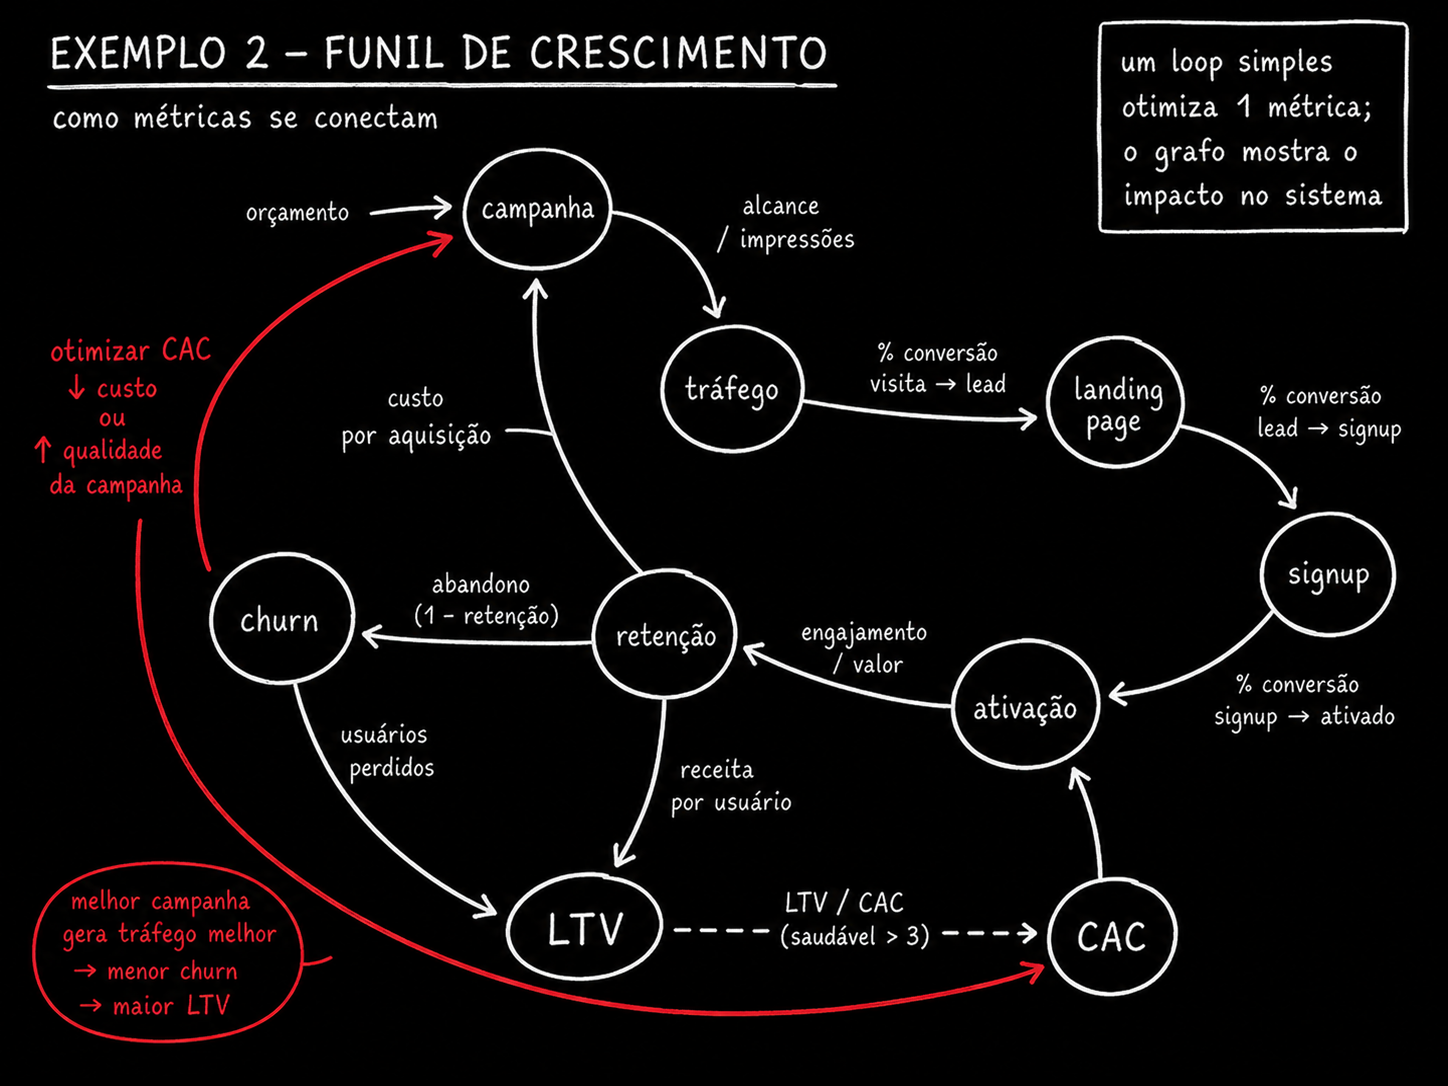
This is the most important example in the module because it sets up the course’s central problem. Campaign → traffic → signup → account created → activation → subscriber → (churn) → LTV. The nodes are customer states; the edges are the conversion rates between them.
🆕 New here? The three acronyms
- CAC (customer acquisition cost): how much you spend, on average, to acquire a new customer.
- Churn: the rate of people who cancel. High churn = leaky bucket.
- LTV (lifetime value): how much money a customer gives you in total before leaving. If LTV isn’t much higher than CAC, the business loses money on every sale.
What to look at: the red dashed line at the bottom. An agent running in a loop with the goal “lower acquisition cost” will see only the first edge and will get right its mission. But it can’t see the dashed line: a cheaper lead is usually a colder lead, churn goes up, LTV goes down—and the business gets worse while the metric improves. This is the technical reason a single metric never being enough.
Key concepts
Each step is a node
The edge percentage
Edge the loop can’t see
Just one always misleads
🎫 Allocate in parallel: the backlog graph
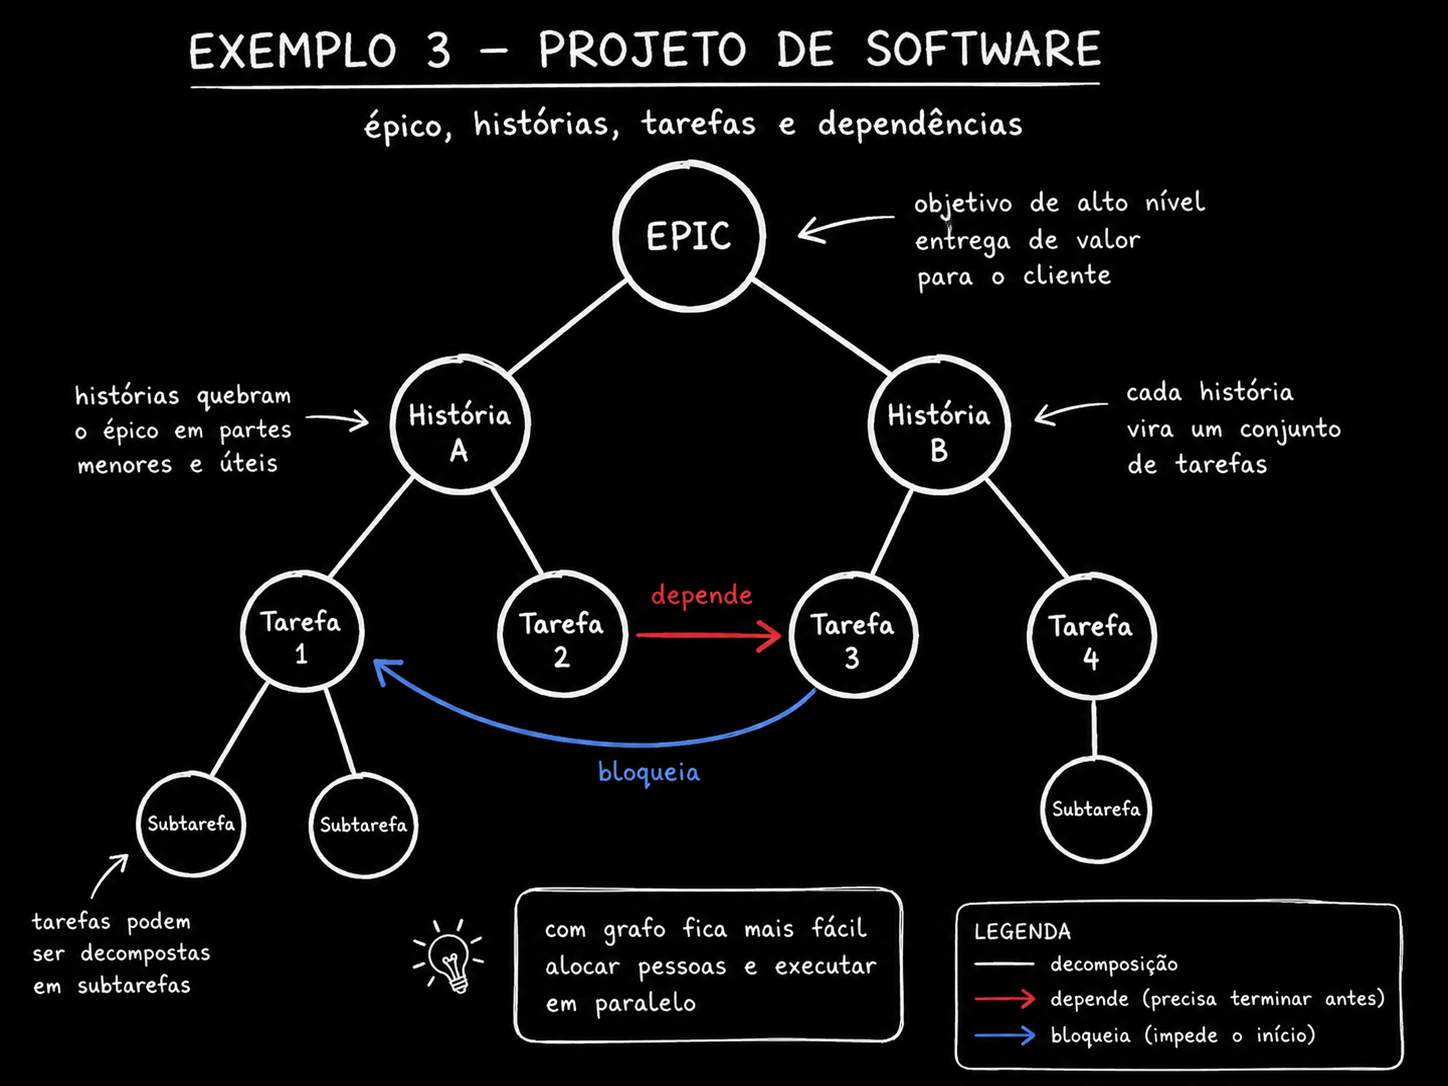
Every large team eventually ends up with a process: first, a epic (the big goal), within it stories (the usage stories), inside them tasks, and sometimes subtasks. That seems a tree. It isn’t: one story almost always depends on another, and then the tree becomes a graph.
And that’s why product managers like this design: the graph answers the question they ask every day — how many people can work here at the same time? If two branches don't block each other, you can run two. When one task finishes, another slot opens up. If two subtasks are sequential, there's no point in assigning two people to them.
What to look at: the red dashed line. Without it, this is a pretty little tree and you’d say “3 people fit.” With it, task B1 can start only after A2—so in reality, only two workstreams can move forward now. That single cross-edge is the difference between a plan that works and a team stuck waiting.
✓ Break down the task to unblock progress
- ✓Build the screen with fake data while the database doesn't exist
- ✓Agree on the contract (the data format) first, and each side handles its own part
- ✓Separate “what decides” from “what executes”
✗ False parallelism
- ✗Put 5 people (or 5 agents) in a branch that only releases 1 node at a time
- ✗Calling two things “independent subtasks” when they both modify the same file
- ✗Ignore the dependency because it's in another epic
Key concepts
Blocking edge
How many fit now
Break it up to free up work
Same account, different fleet
📚 Link the documentation the agent reads
The most common way to give an agent context today is to drop a folder full of files on it .md
and hope for the best. The agent reads everything, burns through context, and still mixes old information with new. The alternative is to turn
this folder into a graph: each document becomes a node, and you declare how one document relates to the other.
🧪 Practical example: turn your docs folder into a graph
Objective: go from “a pile of loose .md files” to a map the agent can navigate. Paste this prompt into Claude Code (or any agent with access to your files), inside the project folder.
Leia todos os arquivos .md em <./docs> e me devolva um grafo de conhecimento em JSON.

Regras:
- Cada arquivo e um no: { "id", "arquivo", "assunto_em_1_frase", "publico" }
- Cada aresta e uma relacao TIPADA entre dois nos. Use SO estes tipos:
  "pre_requisito_de" | "detalha" | "contradiz" | "substitui" | "exemplo_de"
- Se dois documentos se contradizem, crie a aresta "contradiz" e explique
  em uma frase QUAL afirmacao conflita.
- Se um documento nao se liga a nenhum outro, liste-o em "orfaos".

Formato de saida (so o JSON, sem texto em volta):
{ "nos": [...], "arestas": [{"de","para","tipo","porque"}], "orfaos": [...] }
How to verify: three signs that it worked—
(1) the JSON is valid; (2) there is at least one edge contradiz or the list of
orfaos isn't empty (real documentation always has junk); (3) you look at the field
porque of 3 edges and agrees with them. If all the edges are “elaborates,” the agent was lazy — ask again and require a variety of types.
Switch: <./docs> through your folder.
⚠️ Don't confuse it with “graph engineering”
What you just created is a knowledge graph: a graph of information that the agent queries. Graph engineering (Track 4) is a graph of execution: who runs, in what order, with which tools. They’re different things, and the market mixes them up all the time. Track 3 has a table just to clear up that confusion.
Key concepts
One node per file
Not all connections are the same
Less context burned
Knowledge ≠ execution
🧱 Copy from the build: the dependency graph
This is the graph most like the one you’ll build in Track 4—and the good news is that it already exists and has worked
for decades. When you run npm install, make or
a CI pipeline: a tool builds a directed dependency graph and decides on its own what runs first,
what runs next, and what can run at the same time.
🎯 Everything the build has already solved, your agent graph will need
- •Order: nothing runs before what it depends on (topological order)
- •Parallelism: independent branches run together
- •Cache: if nothing changed at that node, don't redo it
- •Cycle detection: circular dependency = explicit error, not a silent freeze
- •Resumption: did it fail midway? rerun only what was missing
None of these ideas is new or exclusive to AI. That’s why many people in the orchestration world reacted to the “graph engineering” hype with a shrug—Track 3 tells that story honestly.
Quick check: In the campaign → ... → LTV funnel, an agent that only looks at acquisition cost can hurt the business. Why, in graph terms?
Key concepts
The ancestor of the work graph
Don't redo what hasn't changed
Detected, not endured
Reruns only what was missing
📌 Module Summary
Next Module:
1.3 — How to traverse a graph: traversal, shortest path, topological order, and cycle detection.